Pro IT Park’s Stellar Looker Studio Reporting: A Data-Driven Success Story
Pro IT Park’s latest Looker Studio report paints a vivid picture of success, showcasing the power of analytics, innovative strategy, and impactful marketing decisions. Designed in collaboration with Pro IT Park’s client, the report is a masterclass in performance tracking, combining insights from OWOX BI Blended Ad Cost and Google Analytics 4 to tell a compelling story of growth and achievement.
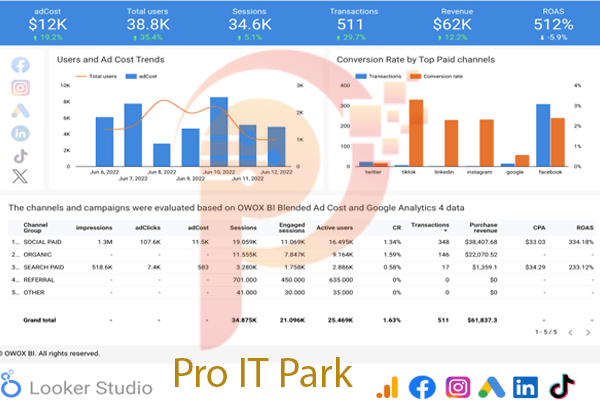
At first glance, the report highlights its primary achievements: $62K in revenue, 511 transactions, and a whopping 512% Return on Ad Spend (ROAS)—numbers that reflect not just growth but optimized efficiency. The detailed presentation merges creativity with clarity, guiding stakeholders seamlessly through a landscape of impactful data.
A Dive into Metrics
The report begins with an engaging header of key performance indicators (KPIs), where the big wins are prominently displayed. The Ad cost of $12K, which resulted in 38.8K total users and 34.6K sessions, demonstrates how well Pro IT Park has optimized advertising efforts. The 29.7% growth in transactions from previous periods further cements the success of their campaigns.
User and Ad Cost Trends
The left chart presents Users and Ad Cost Trends, which visually captures the correlation between investments and user engagement. A blue bar graph highlights user volume growth over time, while a sleek orange line plots ad costs, showing how expenditure translates into tangible results. The harmonious balance between the two metrics is a testament to Pro IT Park’s strategic approach to spending and campaign scaling.
Conversion Rates by Channel
On the right, a bar chart reveals conversion rates for top-paid channels such as TikTok, LinkedIn, Instagram, Google, and Facebook. The standout performer here is Google, which drives high conversions, followed by Facebook. TikTok’s rising popularity as a paid channel also signals diversification in Pro IT Park’s ad strategy. This breakdown empowers the client with actionable insights on which platforms deliver the best ROI.
Channel Performance Analysis
The tabular data at the bottom provides an in-depth look at five major channels—social paid, organic, search paid, referrals, and other. Metrics like impressions, ad click share, engaged sessions, and CPA (cost per acquisition) bring granular clarity to each campaign’s effectiveness. Notably, social paid advertising emerges as the leading channel, driving a significant share of revenue and transactions. This reflects the successful targeting and engagement tactics employed by Pro IT Park’s team.
Design and Presentation
The aesthetic design of the report is both functional and visually appealing. The use of icons for platforms like Facebook, Instagram, Google, TikTok, and LinkedIn ensures immediate recognition of marketing channels, while a clean color palette enhances readability. Each section of the report flows effortlessly into the next, reinforcing a narrative of progress and precision.
The Client’s Perspective
This report stands out not only for its data but also for how it meets the client’s needs. By clearly demonstrating where resources are being allocated and the resulting returns, Pro IT Park has built a foundation of trust and satisfaction. The client’s business decisions are now backed by data-driven evidence, allowing for informed scaling of campaigns and strategic planning for future growth.
In conclusion, Pro IT Park’s Looker Studio report is more than just numbers on a screen—it’s a story of growth, impact, and possibilities. It highlights the potential of smart analytics and creative marketing, establishing a benchmark for success that inspires both the client and their audiences alike.