Pro IT Park’s Stellar Looker Studio Report: A Data-Driven Success Story
At Pro IT Park, we believe that data holds the key to unlocking success in the digital landscape. Our latest Looker Studio report, crafted in collaboration with one of our valued clients, exemplifies how insightful analytics, innovative strategy, and focused execution come together to drive impactful results. With a blend of creativity and precision, this report doesn’t just present numbers—it tells a compelling story of achievement and growth.
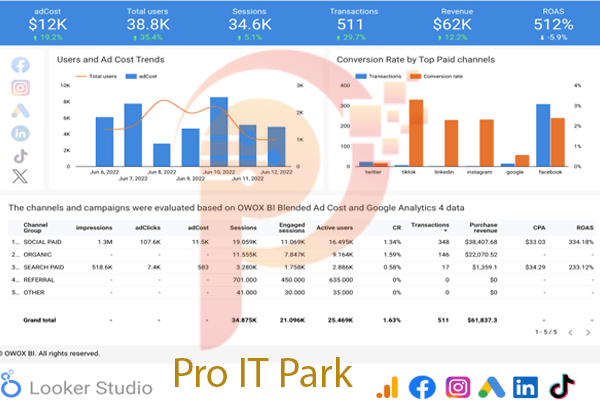
Let’s dive into how $62,000 in revenue, 511 transactions, and an astounding 512% ROAS (Return on Ad Spend) were achieved, all while maintaining cost efficiency and a strategic approach to campaign scaling.
A Snapshot of Success: Key Performance Indicators
The Looker Studio report starts with a high-impact presentation of key performance indicators (KPIs), ensuring stakeholders immediately grasp the magnitude of success. The highlights include:
- Total Revenue: $62,000
- Total Transactions: 511
- ROAS: 512%
- Ad Cost: $12,000
- Users: 38.8K
- Sessions: 34.6K
These numbers alone signify a campaign built on optimization, engagement, and performance. However, the real story lies in the strategies and insights that drove these exceptional results.
Strategic Insights Behind the Metrics
1. Efficient Ad Spend
With an ad spend of $12,000, our team delivered $62,000 in revenue. This translates to a 5x return on every dollar spent, showcasing our ability to maximize client investments. By leveraging tools like OWOX BI Blended Ad Cost and Google Analytics 4, we identified opportunities for budget allocation, ensuring every dollar was directed toward the most impactful channels.
2. User Growth and Engagement
The campaign drove 38.8K users and 34.6K sessions, reflecting a seamless blend of reach and relevance. These figures demonstrate that our ads weren’t just attracting views—they were driving genuine interest, leading users to explore and interact with the client’s offerings.
Visualizing Impact: Trends and Channel Performance
Users and Ad Cost Trends
A standout feature of the report is the left-side chart displaying Users and Ad Cost Trends. Using a clear combination of:
- Blue Bar Graphs for user growth over time.
- Orange Lines to plot ad spend trends.
This visualization effectively shows how incremental increases in ad spending led to proportional gains in user engagement. The harmonious balance between the two reflects our scalable campaign strategy, allowing for growth without diminishing returns.
Conversion Rates by Channel
On the right, a bar chart breaks down conversion rates across top channels, including:
- Google: The top performer in terms of conversions.
- Facebook: Delivering a strong balance of reach and engagement.
- TikTok: A rising star in the paid advertising ecosystem.
This distribution of performance underscores our multi-channel approach, ensuring diversification while capitalizing on platforms that yield the highest ROI.
Analyzing Performance Across Channels
The tabular data at the bottom of the report provides a granular look at the performance of five major channels:
- Social Paid Advertising: Emerges as the leading contributor to revenue and transactions.
- Organic Traffic: Demonstrates the importance of strong SEO and content strategies.
- Paid Search Campaigns: Drives high-intent users, resulting in impressive conversion rates.
- Referral Traffic: Highlights the value of partnerships and collaborations.
- Other Channels: A catch-all category for smaller but valuable sources.
Metrics such as impressions, engaged sessions, cost per acquisition (CPA), and ad click share provide actionable insights into how each channel contributes to the client’s goals.
Pro IT Park’s Methodology: The Foundation of Success
1. Data Integration and Analysis
By combining data from OWOX BI Blended Ad Cost and Google Analytics 4, our team was able to gain a comprehensive view of campaign performance. This integration allowed us to track metrics across the entire user journey, from ad impression to conversion.
2. Advanced Targeting and Retargeting
Using platforms like Google Ads, Facebook, TikTok, LinkedIn, and Instagram, we implemented:
- Custom Audiences: Retargeting users who previously interacted with the client.
- Lookalike Audiences: Expanding reach by targeting users similar to existing customers.
- Behavior-Based Segmentation: Delivering ads to users based on their online actions and intent signals.
3. Campaign Optimization
We used A/B testing to refine ad creatives, messaging, and CTAs. This iterative approach ensured that the campaign adapted to audience preferences in real time, delivering increasingly impactful results.
Aesthetics Matter: The Design of Looker Studio Reports
The success of any report lies not only in its data but also in how effectively it communicates insights. The Looker Studio report was designed to be both functional and visually appealing:
- Icons for Key Platforms: Instantly recognizable logos for Facebook, Instagram, Google, TikTok, and LinkedIn.
- Clean Color Palette: Enhancing readability and focus on critical data points.
- Intuitive Layout: A seamless flow from high-level metrics to detailed channel analysis.
This design ensured that stakeholders could quickly grasp key takeaways while delving deeper into specific areas as needed.
Meeting Client Needs: Building Trust Through Transparency
Pro IT Park’s commitment to client satisfaction is evident in the way this report was tailored to meet their needs. By providing:
- Clear Resource Allocation: Detailing how every dollar was spent.
- Actionable Insights: Highlighting which platforms and strategies delivered the best results.
- Growth Recommendations: Offering data-backed suggestions for scaling future campaigns.
The report not only demonstrated past success but also built a foundation for ongoing collaboration and strategic planning.
A Vision for Future Growth
The achievements outlined in this Looker Studio report are a testament to the potential of smart analytics and innovative marketing. By blending data with creativity, Pro IT Park has set a new benchmark for success. Looking ahead, we aim to:
- Further refine our multi-channel strategies to drive even greater efficiency.
- Expand the use of predictive analytics to anticipate audience behavior.
- Continue delivering exceptional results that inspire trust and growth for our clients.
Conclusion: A Blueprint for Digital Marketing Excellence
Pro IT Park’s Looker Studio report doesn’t just showcase past success—it serves as a roadmap for the future. With $62,000 in revenue, a 512% ROAS, and insights that empower data-driven decisions, this campaign reflects our commitment to excellence and innovation.
For businesses ready to take their digital marketing to the next level, Pro IT Park is your trusted partner. Together, let’s transform data into growth and insights into success.
📧 Contact Us Today
🌐 Explore Our Services
Empower your business with Pro IT Park—the leader in results-driven digital marketing.